
High Yield: Strategies for a Shifting Market
High yield continues to be a credible source of income and diversification in today’s environment—but broad market beta is unlikely to deliver outsized returns, making security selection and disciplined positioning paramount.
Global credit market investors are navigating a landscape defined by diverging growth paths, evolving policy stances and shifting investor sentiment. In the U.S., growth has moderated but continues to exceed forecasts, allowing the Federal Reserve (Fed) to begin easing monetary policy—though this “Goldilocks” mix introduces uncertainty regarding the pace and magnitude of future cuts. Risk appetite is improving as recession concerns fade, and markets seem comfortable that even with some moderation, tailwinds remain. In Europe, the recovery looks more uneven. While overall momentum is the strongest in years, certain regions and sectors—most notably German industrials—continue to face strong headwinds, and the European Central Bank (ECB) has signaled a pause in rate adjustments.
Amid these crosscurrents, high yield bonds and loans have held up well. Flows into high yield bonds remain strong, particularly in the U.S., reflecting confidence in the asset class and persistent demand for yield. Loans have lagged bonds year‑to‑date, driven by underperformance in lower-quality names, but that gap could narrow if rate cuts prove slower than expected. While valuations across the asset class are tight by historical measures, it’s worth noting that spreads can and have remained compressed for extended periods. Importantly, yields are still attractive relative to history, reinforcing that this is very much a carry-driven environment where income continues to be a key source of return.
Figure 1: High Yield Has Outperformed More Rate-Sensitive Asset Classes
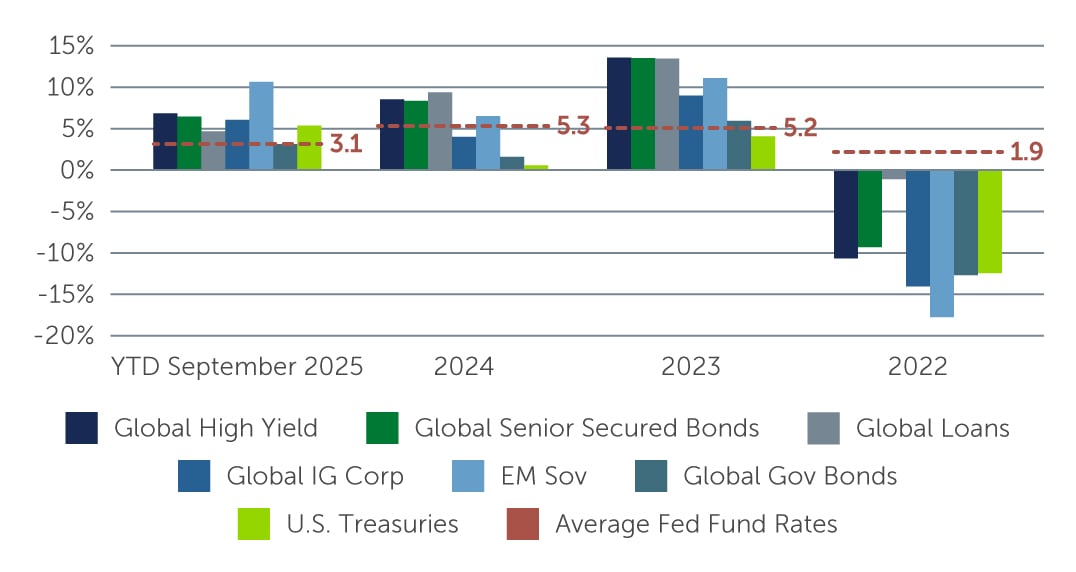 Sources: ICE BofA Non-Financial Developed Markets High Yield Constrained Index (HNDC); ICE BofA BB-B Global High Yield Secured Bond Index (HW4S); Credit Suisse Global Leveraged Loan Index; ICE BofA Global Corporate Index (G0BC); JP Morgan EMBI Global Diversified Index; ICE BofA Global Government Index (W0G1); Bloomberg US Treasury Index (LUATTRUU). As of September 30, 2025.
Improving Fundamentals With Pockets of Dispersion
High yield fundamentals continue to improve. Recent earnings trends show mid single-digit year-over-year growth in both revenue and EBITDA, signaling a steady climb out of the soft patch seen from late 2022 into early 2024. Capital spending has been measured, underscoring issuer discipline. Net leverage, too, is stable to improving, at roughly 3.6x in the U.S. and 3.3x in Europe.1 Reflecting the healthy fundamental picture, the market’s credit quality is high—BBs now account for almost 60% of the global high yield bond market, compared to around 40% a decade ago.2 This stable backdrop has kept the default outlook relatively benign, with bond defaults likely to remain below long-term averages in both the U.S. and Europe.3 In the U.S. loan market, defaults are declining toward historical norms, while in Europe they are projected to rise from exceptionally low levels to around 2–3%—still consistent with long-term averages.4 Notably, this normalization is being driven largely by idiosyncratic factors rather than broad-based stress.
That said, the picture is not completely uniform. In the U.S., the effects of the “two-speed” economy are increasingly evident. On one side are sectors that are holding up well, supported by strong demand and pricing power. Unlike equities, high yield does not have large-cap tech companies whose AI‑driven capex dominates index performance. Still, the ripple effects of AI investment are visible in adjacent areas—such as certain utilities and tech/communications issuers—which is creating select opportunities. On the other side, deep cyclicals like chemicals and housing remain under pressure and will rely on lower financing costs to meaningfully unlock demand. Consumer dynamics add another layer of complexity. Signs of strain among lower-end consumers persist, while the top 10% now account for nearly half of U.S. consumption.5 For credit investors, this dispersion underscores the importance of distinguishing issuers exposed to discretionary, lower‑income demand from those serving more resilient, higher‑income or essential‑services segments.
In Europe, the story is slightly different, in that the market is heavily skewed toward non-cyclical companies with fairly predictable business models. While there are pockets of cyclicality—such as a small portion of automotive and health care names that are currently under pressure—these segments account for only a fraction of the overall market. As a result, periods of volatility or sector-specific stress tend to be contained, allowing investors to navigate the opportunity set with greater clarity and selectivity.
A Technical Headwind in Europe
Despite this generally stable backdrop, one area warrants greater caution: the European loan market, which is facing a strong technical headwind. With default rates on the rise, collateralized loan obligation (CLO) managers—key buyers in the loan market—have grown increasingly cautious of lower-rated credits, particularly those at risk of being downgraded to CCC. This has led to pronounced underperformance among these credits as CLOs and other market participants have reduced their exposure. The result is a bifurcated market: while fundamentals remain strong for most issuers, a small segment of lower-quality loans has experienced significant price pressure and volatility.
Although this technical dislocation has created short-term challenges, it’s also paving the way for selective credit picking in oversold names. For managers who can distinguish between fundamentally sound credits and those facing genuine distress, there may be opportunities to buy high-quality deals that are trading below what fundamentals would suggest (and at levels that overcompensate for potential defaults). In other words, while technical volatility has added complexity, it has also opened the door for credit-focused managers to capitalize on mispricings and uncover value in a market that remains fundamentally resilient.
Breaking Down the Opportunity
In the current environment, high yield bonds look particularly attractive for their strong coupon-driven income and short duration (roughly 3 years). In our view, this combination provides significant downside buffers in a world where spreads are tight, and the direction of rates is favorable but not guaranteed—presenting an opportunity to achieve strong total returns over the next couple of years. In the U.S., single-B credits stand out as a segment where careful credit selection can add incremental value, supported by stable fundamentals and a deep, liquid opportunity set. Lower‑rated CCC bonds have rallied at points this year, but dispersion in that segment of the market makes selectivity and rigorous, bottom-up analysis essential.
The appeal of loans remains rooted in their senior secured positioning and floating-rate coupons. Despite the recent decline in base rates, loan coupons today remain well above their 10-year average.6 That said, given loans’ underperformance relative to bonds this year, the opportunity set is arguably more selective, and we favor targeted credit selection over broad, beta-level exposure. Going forward, if the pace of rate cuts ends up being slower than the market anticipates, loan market dynamics could improve, particularly in the U.S.
Key Takeaway
High yield continues to be a credible source of income and diversification in today’s environment. However, broad market beta is unlikely to deliver outsized returns, making security selection and disciplined positioning paramount. The most durable outcomes will come from identifying idiosyncratic catalysts, avoiding problem credits, and capitalizing on technical mispricings. With fundamentals improving at the margin, selective policy tailwinds in place, and technicals creating dispersion, active management is essential. Going forward, maintaining a balanced allocation across regions and markets will be key to preserving carry while keeping the flexibility to add risk during pullbacks.
1. Source: CreditSights. Representing high yield bond markets. As of June 30, 2025.
2. Source: ICE BofA; Barings. As of September 30, 2025.
3. Source: ICE BofA; UBS. As of September 30, 2025.
4. Sources: S&P UBS Leveraged Loan Index; S&P UBS Western European Leveraged Loan Index; J.P. Morgan; Pitchbook. As of September 30, 2025.
5. Source: Moody’s; U.S. Federal Reserve. As of June 30, 2025.
6. Sources: Barings; S&P UBS Leveraged Loan Index; Bloomberg. Averages from January 31, 2014. As of September 30, 2025. For illustrative purposes only.
25-4876613