High Yield: Can the Strength Continue?
Despite risks surrounding the direction of the global economy, high yield bonds and loans continue to offer attractive total return potential for long-term investors willing to look beyond the likelihood of near-term volatility.
The prospect of the Fed’s rate-hiking cycle reaching its end, coupled with continued strength in consumer spending and the labor market, has caused credit spreads to tighten in recent weeks. Despite Europe’s economic doldrums and its central bank being unlikely to cut rates until it sees a break in persistent inflation, there is a widespread sense in the U.S. that a soft landing is achievable. But with credit spreads now trading toward the tighter end of historical averages, some investors are beginning to question whether the strength in high yield can continue. In our view, there is still value to be found in the asset class, and if investors can remain patient, potentially attractive total returns await.
Corporate Resilience
Although corporate earnings trended lower overall during the first half of 2023, earnings inflected positively in the third quarter and expectations, by and large, are for positive fourth-quarter performance that could continue through the first half of this year. That said, we will likely see some bifurcation. Sectors that are interest rate sensitive, highly leveraged and cyclical, for example, have a higher risk of potential profit shortfalls.
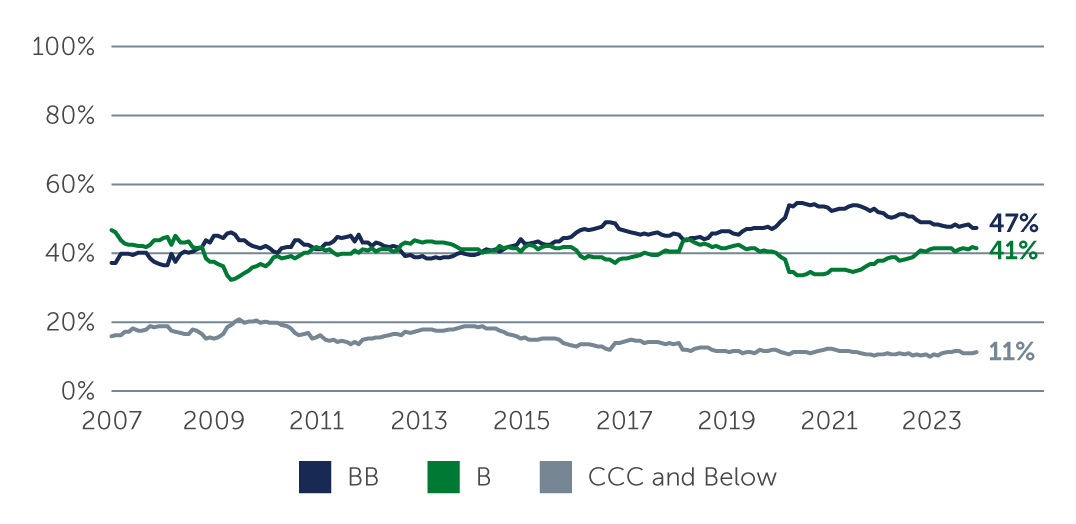
Regardless of earnings at this juncture, the credit quality of the high yield market is much higher than it has been historically. While Europe has historically been more of a BB market, most U.S. high yield issuers today are now BB as well—a seismic shift from a decade ago (Figure 1). At the same time, the lowest-rated CCC issuers account for only 11% of the market today, versus nearly 20% 10 years ago.
Figure 1: A Higher-Quality High Yield Market
 Source: ICE BofA. As of December 31, 2023.
Encouragingly, many high yield issuers have been shoring up their financial positions over the last few years, leaving them well-prepared, from a fundamental standpoint, to weather a possible downturn—particularly one that is milder than expected. Corporate net leverage remains at historically low levels in both the U.S. and Europe, at roughly 3.55x and 3.7x, respectively, while interest coverage also looks manageable.1 Corporate profits, in the form of EBITDA, are in many cases back to or better than pre-Covid levels. At the same time, near-term maturities remain limited, with roughly 7% of the U.S. market coming due over the next 18-24 months.2 Because the majority of that debt is BB, the issuers likely won’t face significant refinancing risks.
Although default rates inched up in the first half of last year due to some idiosyncratic cases, the combination of a higher credit quality profile, low leverage, ample cash cushions and limited near-term maturities suggests they are unlikely to increase significantly—and may even hold steady or decline—in the near to medium term.
Reasons For Optimism
Given expectations for an economy more likely to suffer a head cold than the flu, the potential risks in credit vis-à-vis other major asset classes appear to be contained. Nevertheless, with volatility likely to remain elevated, we continue to favor higher-rated (and higher-quality) bonds and loans, where we believe yields remain compelling. Recently, yields on BB-B bonds were hovering around 7.2%, for example, while loans were around 7.9%.3 Although spreads have tightened in recent weeks, yields at these levels—in the context of a positive fundamental picture, improving default outlook and potentially less problematic economic backdrop—pave the way for potentially attractive total returns across the asset class, especially for investors that are willing to hold on through further bouts of volatility.
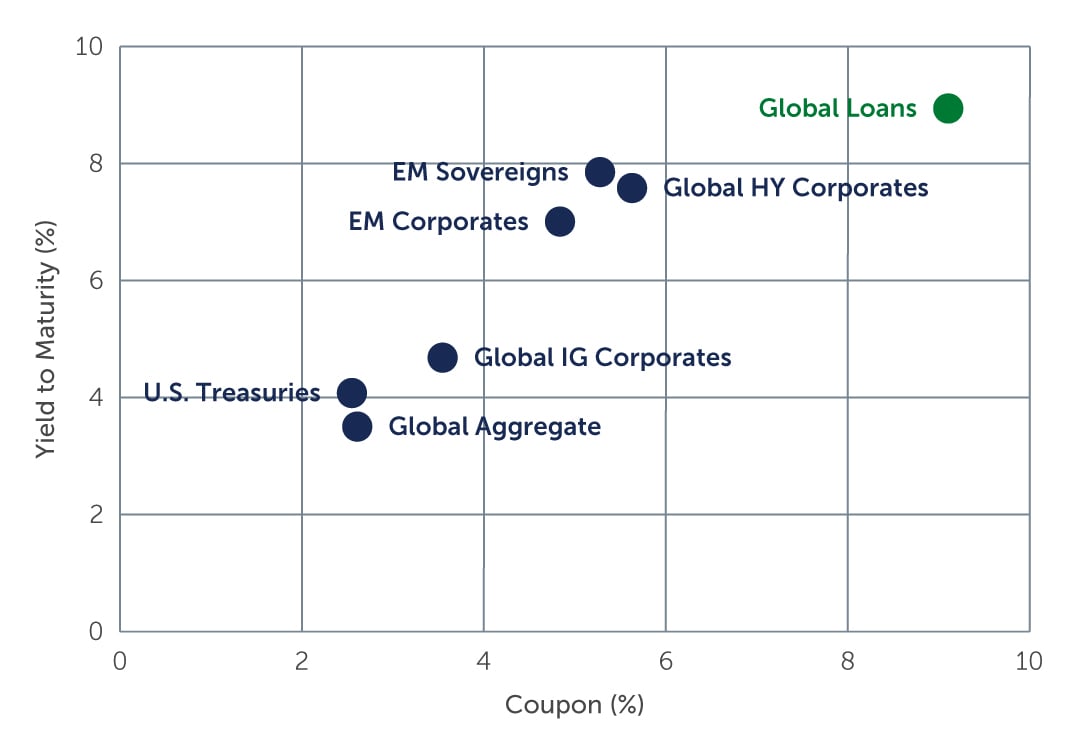
Looking at loans specifically, coupons today are around 9.11%—well above the long-term average of 5.46%—as a result of the increase in short-term rates and general steadiness in stated spread.4 For a market that has historically provided total returns in the 4%–6% range, coupons at these levels suggest strong potential for above-average total returns going forward. While yields across all fixed income markets are elevated, as mentioned, the loan asset class stands out not only for being at the top of the list, but also because the bulk of its yield is coming from contractual income that is being paid today rather than awaiting price recovery.
Figure 2: Elevated Yields, Contractual Income
 Sources: Credit Suisse; J.P. Morgan; Bloomberg. As of December 31, 2023.
Looking Ahead
Many macro and micro uncertainties lurk in the months ahead, any of which could derail the relatively benign outlook. From a macro perspective, the U.S. presidential election and China’s recovery are top of mind, along with ongoing conflict in Eastern Europe and the Middle East. On the micro level, the troubled commercial real estate sector, for example, could see several borrowers downgraded as their debts come due, casting a negative light on the high yield bond and loan markets overall. Fortunately, our exposure in that area is very minor.
As a result of the uncertainties that prevail, this is not a time to take excessive risk to earn higher returns, despite the presence of opportunity and value in the market. We believe that a bottom-up, credit-by-credit analysis remains crucial, particularly when it comes to potentially achieving compelling total returns going forward.
1. Source: Bloomberg. As of December 31, 2023.
2. Source: ICE BofA. As of December 31, 2023.
3. Source: ICE Indices, Credit Suisse. As of December 31, 2023. BB-B yields reflect BB, Split B and B-rated market segments.
4. Source: Credit Suisse Global Leveraged Loan Index. As of December 31, 2023.


