
Higher Yields Burnish IG Credit’s Luster
Spreads continue to grind tighter—but current elevated yields, combined with the potential for attractive total returns, continue to draw investors into IG credit.
Investment grade (IG) credit yields have risen roughly 25 basis points (bps) since the start of the year, to highs rarely seen over the past 15 years (Figure 1). This is continuing to attract investors to a market that appears to be reaching the limits of any further significant spread tightening. In the first quarter, spreads tightened from 93 bps to 85 bps in the U.S.—which compares to a 10-year average of 117 bps.1 The rally was even more pronounced in the European market. While corporate fundamentals overall have softened, the backdrop of a U.S. Federal Reserve (Fed) likely at or near peak rates, and consensus estimates pointing to lower policy rates this year and into 2025, remain supportive. In addition, while spreads are tightening, there is also wide dispersion throughout the market, and this continues to provide ample opportunities.
Figure 1: Current Yields Are at Levels Rarely Seen in the Past 15 Years
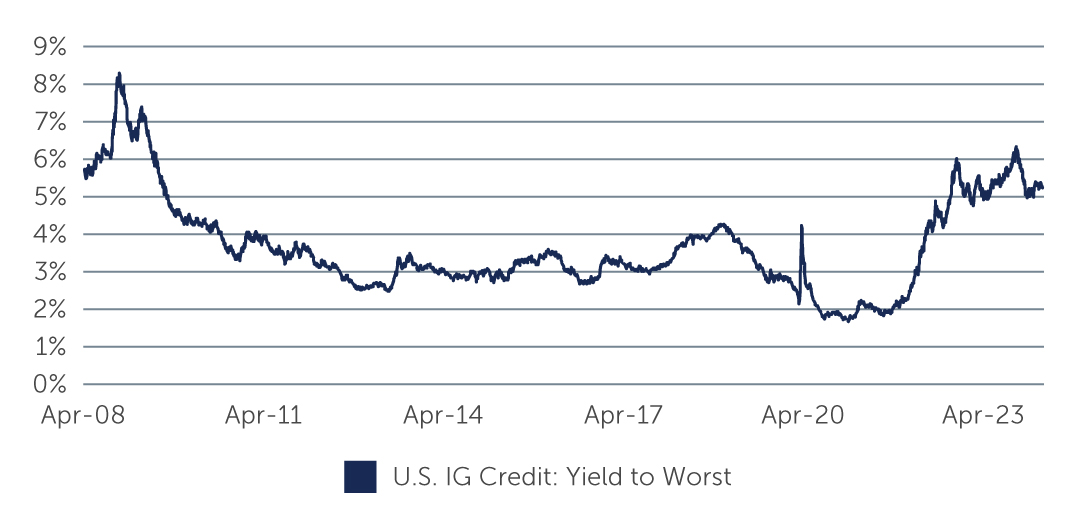 Source: Bloomberg. As of March 31, 2024.
Favorable Technicals Balance Softer Fundamentals
The higher yields on offer led to $182 billion of inflows to the IG corporate market in 2023.2 An additional $82 billion has entered IG credit this year, maintaining the market’s technical strength. Demand is especially strong from pension funds and insurers. Specifically, many pension funds, particularly in Europe, have reached a fully funded status, and are therefore trying to better match their assets and liabilities. As a result, they are de-risking their portfolios and moving toward IG credit, and will likely be a stable source of demand this year. Meanwhile, insurers are becoming more active in the market due to a surge in demand for fixed annuities, sales of which have risen from roughly $10 billion in 2020 to about $50 billion annually.3
In terms of new issuance, the supply of $537 billion has been somewhat of a technical headwind in the first quarter—almost on the same level as the record $541 billion issued in the first quarter of 2020.4 However, sell-side estimates foretell meaningfully slower new issuance as the year progresses. With inflows continuing to exceed outflows, and lighter issuance, technicals are likely to remain supportive.
Continuing the trend, fundamentals continued to soften in the fourth quarter, but more so among industrial companies than among financials. Leverage at industrial companies increased slightly to 3.2x, while interest coverage declined on a year-over-year basis to 10.0x.5 Revenue and EBITDA also were lower year-over-year. However, the weakening in fundamentals could potentially be bottoming out as margins stabilized—roughly half of the sectors in the IG corporate universe reported lower margins in the fourth quarter, while half reported higher margins. And while capital expenditures were also higher, the increase was the smallest in the last nine quarters, indicating that companies are pulling back somewhat on spending. Additionally, shareholder returns from dividends and buybacks have decreased for five straight quarters.6
At the same time, the overall picture on corporate fundamentals remains solid, with the ratings profile of the market the highest it has been since 2015. Specifically, the proportion of BBB- ratings is at its lowest since then, while A is at its highest.7
Attractive Total Return & Idiosyncratic Opportunities
History is on our side
Looking at IG credit overall, history suggests that there is strong potential for attractive returns in the months and years following the last rate hike in the Fed’s tightening cycle. For instance, over the last 40 years, after the end of central bank rate-hiking cycles and ahead of rate cuts, IG corporates and core global bonds have significantly outperformed (Figure 2). In particular, during that period, the average total return for the asset class was 9%, 15% and 11% in the following six months, one year and three years (annualized), respectively.
Figure 2: IG Credit Total Returns Following Final Fed Rate Hike
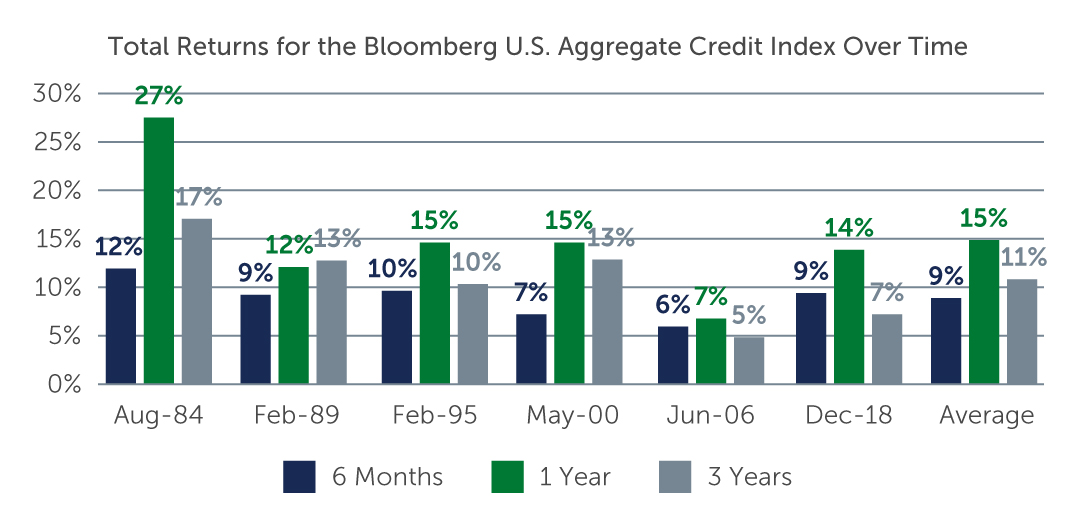 Source: Bloomberg. As of February 20, 2024. Returns for periods longer than one year are annualized.
In addition, the wide dispersion in spreads across IG credit continues to shape compelling idiosyncratic opportunities. From a sector standpoint, we continue to see opportunities in financials, particular in banking, life insurance, and real estate investment trusts—although not to the same degree as last year given the level of outperformance seen already this year. Within financials, Yankee bonds from large foreign banks look attractive relative to U.S. banks. We also see value in select callable AT1 securities from European banks, which are offering yields that are compelling.
Within energy, the ongoing consolidation in the sector may present attractive opportunities in fundamentally strong credits as a number of high yield issuers potentially move into the IG universe. We also see value in select issuers in the technology and utility sectors, given the higher ratings and defensive qualities, respectively. In addition, the technical dislocation in the U.S. agency-backed mortgage market is presenting an attractive opportunity. In particular, a thinner buyer base and increased supply have resulted in valuations trading at wide levels rarely seen over the past decade.8 For long-term investors, these conditions may present an attractive entry point.
Looking Ahead
The tightening of spreads across the credit spectrum signals that the tailwinds supporting the market have slowed to more of a gentle breeze. While spreads may move somewhat tighter from here, they could also widen if economic conditions deteriorate. With little to be gained by going down the ratings scale or by extending duration, this is a time for investors to be conservative and to focus on the higher quality and overall good corporate health of the IG market. At the same time, being open to opportunistic and idiosyncratic situations that can become available in a market as diverse as IG credit may be beneficial—but a fundamental, bottom-up approach to credit investing remains key.
1. Source: Bloomberg . As of March 31, 2024.
2. Source: Bloomberg. As of December 31, 2023.
3. Source: JP Morgan. As of December 31, 2023.
4. Source: Bloomberg. As of March 31, 2024.
5. Source: JP Morgan. As of December 31, 2023.
6. Source: JP Morgan. As of December 31, 2023.
7. Source: J.P. Morgan (ex-EM issuers). As of January 4, 2024.
8. Source: Barings. As of February 21, 2024.