
EM Debt: Are the Biggest Risks Behind Us?
With many EM elections now behind us, EM debt looks well-positioned heading into the remainder of the year. But with geopolitical tensions continuing to rise, and in the lead-up to the U.S. presidential election, a selective approach will be key.
Some of the major risks facing emerging markets (EM) debt heading into this year have either passed or subsided. Many EM elections, for instance, are now behind us. And while certain outcomes were more encouraging than others, there are reasons for optimism based on the way that governments are being shaped in a number of countries. For example, while the election outcome in South Africa drew negative attention initially, the newly formed government has expressed its intention to pursue sound macroeconomic policies, which could benefit the economy and stabilize the South African rand. Mexico, too, is seeing signs of stability following the elections as president-elect Claudia Sheinbaum made some initial cabinet announcements.
Additionally, inflation has started to ease in developed markets, bringing back the potential for U.S. Federal Reserve (Fed) rate cuts—largely considered a positive for EM. These factors, combined with the solid fundamental backdrop and sound credit quality of the asset class, have contributed to spread tightening (Figure 1). However, as is often the case, spreads alone aren’t telling the full story—and for those willing and able to take a more considered and holistic view of the market, compelling opportunities may await.
Figure 1: EM Spreads Look Tight, but There Is More to the Story
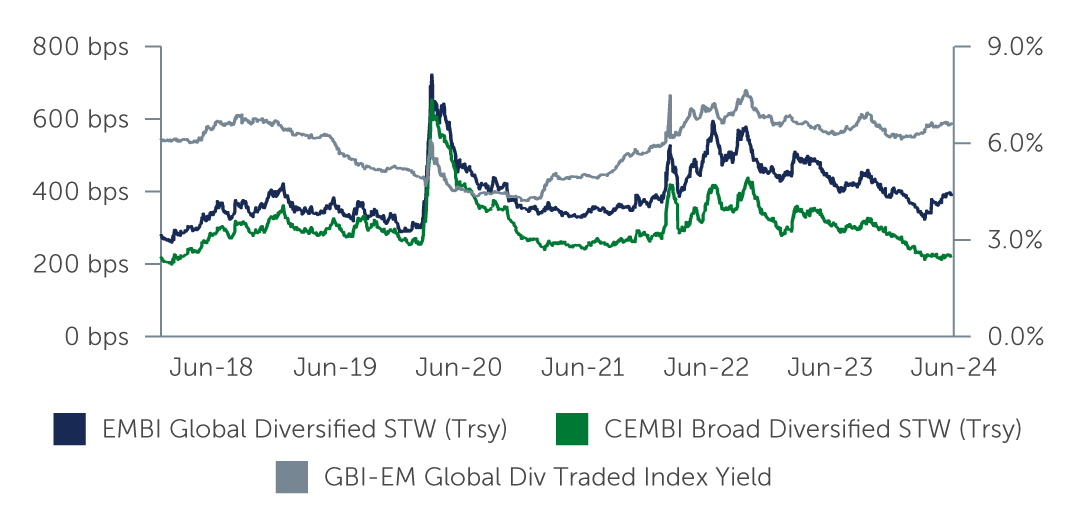 Source: J.P. Morgan. As of June 30, 2024.
EM Sovereign Debt: Are Spreads Too Tight?
While a superficial look at EM sovereign debt spreads suggests they may be too tight to offer attractive upside, we disagree. As we noted in this recent piece, there is no fundamental reason to believe that EM sovereign spreads are too tight. In particular, spreads should be considered too tight when they undercompensate for the risk of permanent losses (i.e., the probability of default multiplied by the loss given default). Based on the probability of default that we assign to EM sovereigns and a recovery rate in the event of default, the debt of most EM sovereigns appears to overcompensate for default risk—suggesting that investors are earning an attractive premium to own sovereign credit risk today.
Additionally, the aforementioned high level of U.S. Treasury yields provides sovereign debt a margin of safety that has reduced market risks, and therefore the amount of spread that is needed to compensate for that risk. In countries where the market risk component of spreads has diminished substantially, and where spreads still meaningfully overcompensate for default risk, we believe there is still scope for spread compression, even amid these seemingly tight levels. At the same time, elevated U.S. Treasury yields have provided a boost to EM sovereign debt yields, suggesting the asset class is also attractive on a historical basis (Figure 2). Excluding the global financial crisis shock during 2008–2009, both the all-in BBB sovereign debt yield and the overall EM sovereign index yield, at 5.9% and 8.4%, respectively, are currently near 20-year highs.1 Underscoring its potential value, EM sovereign debt has exhibited a strong history of outperformance versus both U.S. Treasuries and other risk assets. Drawdowns have historically been short, and rebounds strong, particularly in the high yield segment of the market—and we believe this time is no different.
Figure 2: Elevated U.S. Treasury Yields Lift EM Sovereign Yields Higher
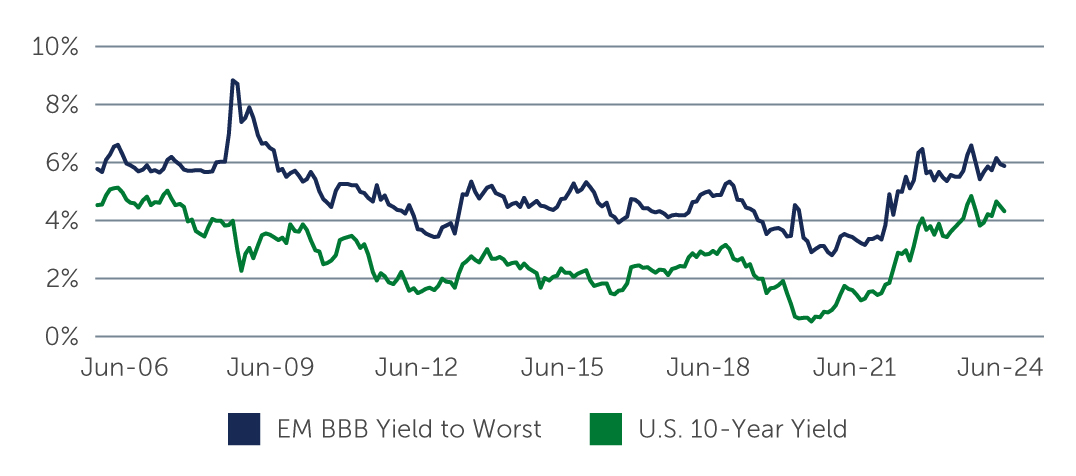 Source: J.P. Morgan. As of June 30, 2024.
Against this backdrop, we see compelling risk-reward potential in BB sovereigns with strong fundamentals, where the carry and potential for spread compression look attractive. This includes countries such as Serbia, Costa Rica, Dominican Republic, Jamaica and Albania. For Cost Rica, Dominican Republic, and Jamaica, there are also strong trade linkages to the U.S., which should further support credit fundamentals. We are generally underweight and remain very selective on single-B and CCC sovereigns. In the investment grade (IG) space, we see limited value in China and GCC sovereigns, where spreads are tight and do not sufficiently compensate for domestic and geopolitical tail risks. Conversely, we remain largely comfortable with Mexico. Despite the recent political unrest, the economy is diversified and competitive, and continues to benefit from reshoring and strong ties to the U.S.
EM Local Debt: Currencies’ Time to Shine?
In the local debt space, the rally in the rates market has eased over the last two to three months as some EM central banks have slowed their pace of rate cutting, and in cases like Brazil, stopped cutting rates altogether. For the most part, we view this as a temporary phenomenon, and a result of EM central banks viewing the economic recovery in their countries as a potential upside risk to inflation. In many cases, the production capacity of these countries is higher than the rebound in economic activity, resulting in a large output gap that is unlikely to fully close without further help from central banks. As a result, we see the potential for additional rate cuts in select EMs and are more constructive on those countries’ rates going forward. These include Colombia, Chile and South Africa, as well as a number of countries across central and eastern Europe.
Supporting the case for EM local debt, the international reserves among EMs have risen fairly consistently over the past 18 months. What this means for investors is that EM economies are seeing inflows that could precede potentially positive returns going forward. These inflows, coupled with the wide interest rate differential between EMs and DMs, have made EM currencies increasingly attractive—with many looking poised to appreciate after depreciating significantly in recent months, in some cases to the cheapest levels in several quarters. The South African rand and select Asian and European currencies looking particularly compelling today.
The case for EM local markets is further reinforced by the fact that inflation-adjusted interest rates in EM today are significantly higher than their respective sovereign hard currency spreads almost across the board. We also believe the risk of U.S. interest rates limiting the downside potential of EM rates has diminished considerably, given that the U.S. 10-year nominal rate is already the second highest among 15 developed markets and the fifth highest among 22 EMs. In general, an increasing number of interest rates have been trading below the U.S. interest rate.
Corporate Debt: Value in a Short-dated Approach
In the EM corporate market, spreads continue to tighten. However, both on an absolute and risk-adjusted basis, current yields across EM corporates continue to look attractive. From a fundamental perspective, EM corporate leverage levels remain manageable and below those in developed market corporates. In addition, the credit quality of the market is good with around 60% of the EM corporate universe rated IG, with significant sector diversification across credit ratings.2
We also see technical tailwinds supporting the market. In particular, funds are being reallocated from money market funds into developed market IG—and flows are also coming from insurance annuity product growth, which is providing crossover demand tailwinds for select segments of EM corporates. New issuance remains measured, with balanced contribution across the regions. Net financing started the year at a modest positive but has turned negative again as modest gross supply was more than offset by elevated cash flows. In particular, given the favorable macro environment, and with expectations of market volatility likely later this year, companies have been cautious and frontloaded their funding plans during the first half of the year. New and less frequent issuers came to the market to lock in costs and get ahead of the potential noise in the coming months, taking new issuance to $32 billion, compared to $18.9 billion in the same period last year.3 At the same time, investors have been eager to put cash to work and lock in the level of coupons before possible rate cuts.
Heading into the second half of the year, given the potential for continued volatility in the risk-free rate, there is a strong case to be made for short-dated debt. EM corporate short duration debt, which typically has a duration of under three years, not only offers the potential for compelling value and attractive yields, but also positions investors to maximize income through a ‘coupon clipping’ strategy—all with less volatility. For instance, yields on 1–3 years EM IG bonds are currently ranging from 5.5%–6%, compared to 5.4% for developed market IG bonds, while EM HY bonds are in the range of 8%–10%, versus 8.1% for DM HY bonds (Figure 3).
Figure 3: Yields Remain Compelling in EM vs. DM
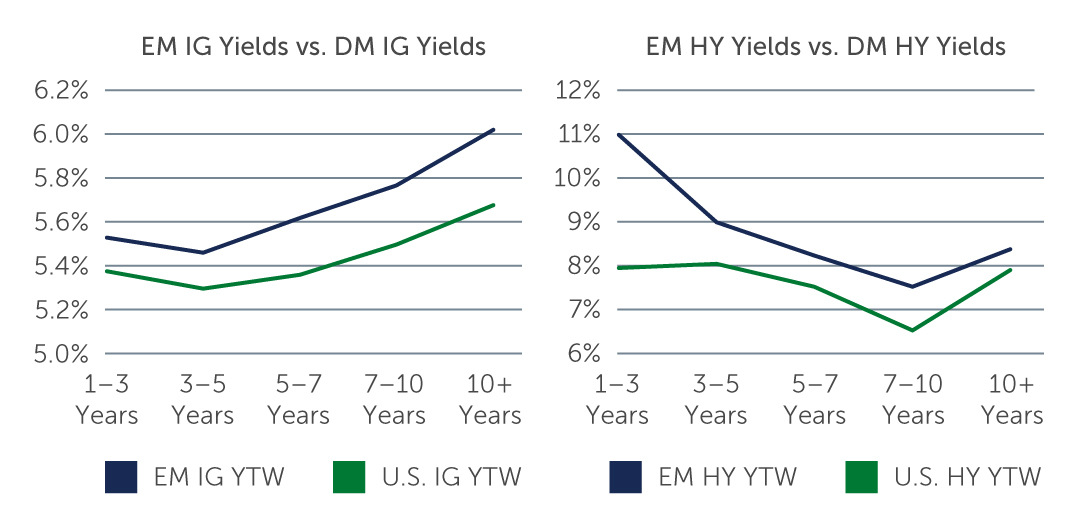 Source: J.P. Morgan. As of May 20, 2024.
Looking Ahead
EM debt looks well-positioned heading into the second half of the year, with potentially compelling value on offer across sovereign hard currency, local and corporate debt. However, while a number of risks are now behind us, others remain, any one of which could introduce bouts of volatility going forward. The U.S. presidential election, in particular, could have wide-reaching implications for EM debt. A scenario where former President Donald Trump is re-elected, for instance, could call into question a number of major international policies and also raise doubts around the independence of the Fed going forward. At the same time, concerns remain around growing political tensions in Europe and the Middle East, as well as China’s economic strength and geopolitical intentions.
Against this backdrop, extensive credit-by-credit analysis and rigorous, bottom-up credit and country selection are critical to not only to managing risks, but also identifying issuers that are better-positioned to navigate the coming months.
1. Source: J. P. Morgan. As of June 30, 2024.
2. Source: J. P. Morgan. As of March 31, 2024.
3. Source: BofA. As of June 30, 2024.