
High Yield: A Continued Bright Spot
Compelling income opportunities supported by favorable fundamental and technical conditions continue to attract investors to high yield bonds and loans.
Elevated yields and the potential for attractive income and carry continue to draw investors to high yield, despite modest spread tightening year-to-date. While U.S. Federal Reserve rate-cut odds are shifting almost daily, the higher-for-longer backdrop looks likely to persist, which also bodes well for the asset class—particularly within the context of a strong fundamental and technical picture. To be sure, there are a number of risks that could introduce bouts of volatility in the coming months. But high yield has proved its mettle so far and looks well-positioned to stay the course.
Sound Fundamentals, Strong Technicals
Corporate profitability continues to advance at a modest pace and in line with expectations, with companies still able to generate sufficient cash flow to cover their debt and capital expenditures. High yield issuers also remain in good financial health overall, with many having shored up their financial positions over the past few years. Net leverage remains low in both the U.S. and Europe, for instance, at roughly 3.4x and 4.5x, respectively.1 As a further reflection of issuers’ overall strength, the credit quality of the market continues to rise. The percentage of BB issuers in the global high yield bond index is near all-time highs, at 55%, while the percentage of CCC issuers is around 11%—roughly half of what it as a decade ago.2
From a technical perspective, unusually strong and positive forces continue to dominate the high yield market. On the bond side, the market has shrunk by around $250 billion, or just under 15%, over the last two years, meaning inflows into the market are chasing fewer opportunities (Figure 1). This is partly due to the lower level of M&A activity—a product of some private equity firms struggling to find buyers for companies that were acquired or recapitalized during the years of much lower rates. New issuance has also remained light, although refinancing activity has started to increase and is expected to continue to gain momentum heading toward year-end. Also contributing to the shrinking market for bonds, a number of high yield credits were upgraded to investment grade over the last 18-24 months as companies took material steps to pay down debt and increase liquidity. This positive technical should remain supportive of the market going forward.
Figure 1: The HY Bond Market Has Shrunk, Providing a Strong Technical Backdrop
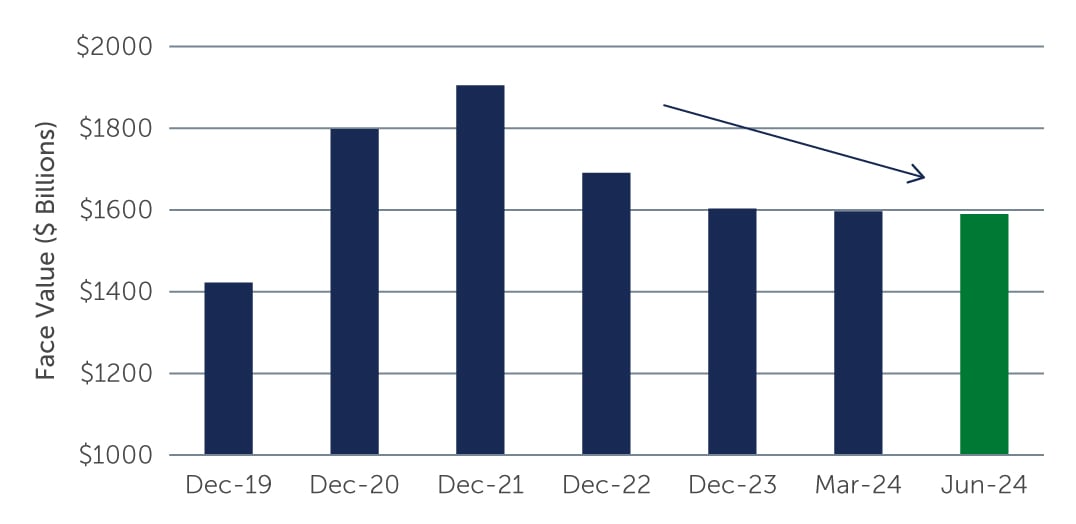 Source: ICE BofA. As of June 30, 2024.
On the loan side, the technical strength is more a factor of the ongoing (and robust) demand from asset managers creating collateralized loan obligations (CLOs). An estimated two-thirds of demand is coming from CLO formation, which has continued at a breakneck pace through the first half of the year. On the supply side, primary market activity has increased modestly but remains concentrated in refinancing transactions. More specifically, in the absence of meaningful M&A activity, issuance has largely come from private equity firms issuing loans to extend the life of their current borrowings to match what have become longer holding periods. There also have been some large private market deals, in the range of $500 million to $1 billion, that have returned to the public market to refinance. Roughly $23 billion of private debt deals have refinanced in the public market year-to-date, with that number expected to potentially double by year-end.3 But overall, demand continues to outpace supply, a dynamic we expect to persist through the remainder of the year.
Positive Momentum
Given the still-strong fundamental and technical pictures, the case for high yield bonds and loans remains compelling, with both markets positioned to potentially deliver high single-digit returns this year. With rates likely to remain elevated, loans in particular continue to stand out. The higher-for-longer environment has kept the average coupon for loans at roughly 9%, well above the long-term average of 5.6%.4 While yields are high across most fixed income asset classes, loans look particularly appealing because the majority of the return is coming from contractual income that is being paid today rather than awaiting price recovery. At the same time, the income component has historically resulted in a steadier return profile.
Figure 2: Loan Coupons Remain Above Average
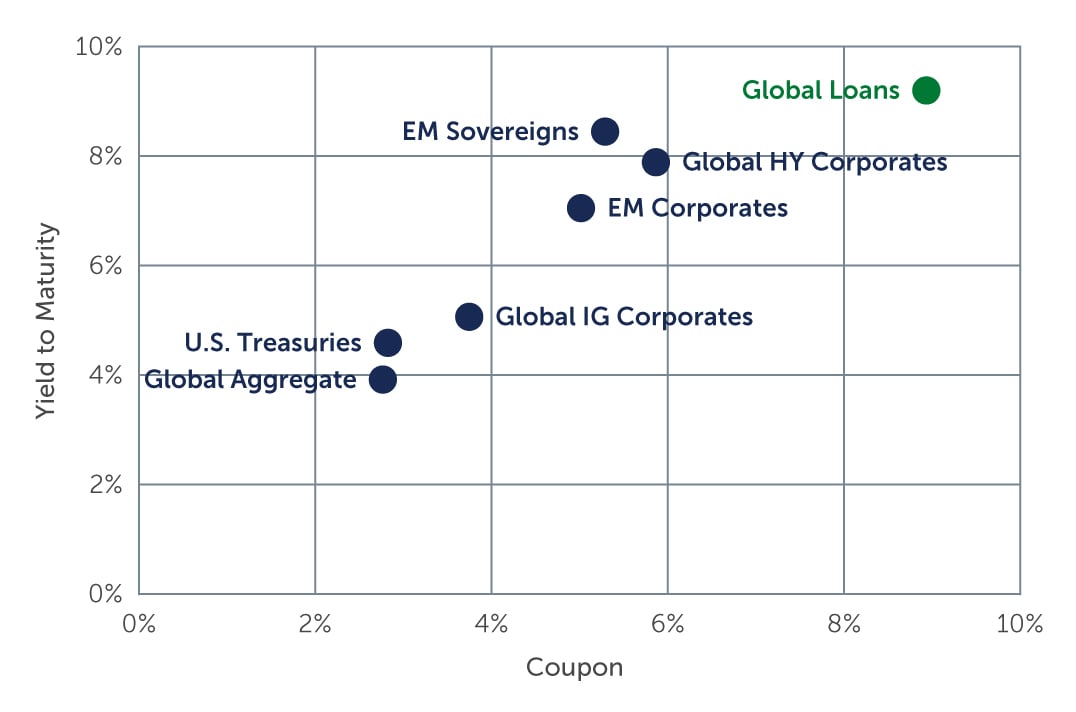 Sources: Credit Suisse, J.P. Morgan, Bloomberg. As of June 30, 2024.
In addition, the high level of repricings conducted over the last few months has dramatically reduced the percentage of loans trading above par. Coming into the year at nearly 40%, strong demand largely from the increased level of CLO issuance saw the percentage peak at around 60% in the U.S. loan market in May—but this has fallen back down to around 35% today, creating a far more balanced market.5 That said, we continue to see pockets of value in select discounted opportunities, particularly in the U.S., but these should be approached carefully and after considerable analysis because of their complexity. For instance, liability management exercises (LMEs), which are ways to recast or restructure existing debt arrangements, have become more prevalent for stressed situations. For managers that have the resources to dig deep and rigorously analyze risk, these can offer potentially compelling value.
The total return story is compelling for bonds as well. While spreads remain near historical tights and are the focus of continued investor attention, there is much more to the story than spreads alone. The lower duration of the asset class, for instance, is a key part of its value proposition. At just over three years, the average duration of the market suggests that bonds are more protected from interest rate swings than in the past.6 Another key feature of the market is its callability. While spreads and yields-to-worst are calculated based on a bond’s legal maturity, most high yield companies refinance well before that. Early calls can have a significant impact on returns, typically adding 50 to 100 basis points when bonds are trading at a discount to par, as they currently are. Based on our estimates, about 25% of the market today is underpriced based on this dynamic.7
Looking Ahead
Given the elevated yields across the market and the potential for attractive income and carry, the case for high yield remains compelling—and we expect 2024 to be a strong year for high yield overall. That’s not to say the next several months will be without risks, and with a looming U.S. presidential election and ongoing wars in Ukraine and the Middle East, bouts of volatility are certainly possible. In this environment, and given the idiosyncratic opportunities that can arise in a market as diverse as high yield, the value of rigorous analysis from teams with both breadth and depth of resources remains significant.
- Source: J.P. Morgan. As of December 31, 2023.
- Source: ICE BofA. As of June 30, 2024.
- Source: Pitchbook LCD. As of June 30, 2024.
- Source: Credit Suisse. As of June 30, 2024.
- Source: Credit Suisse. As of June 30, 2024.
- Source: ICE BofA. As of June 30, 2024.
- Source: Barings’ estimates. As of June 30, 2024.