
High Yield: Charting a Steady Course Through Roiling Seas
Banking stresses added volatility to first-quarter markets already coping with rising rates and recession fears. Still, with corporate fundamentals sound, high yield investors and issuers are more cautious than fearful.
Triggered by the failure of Silicon Valley Bank and Signature Bank, many equity investors fled to safety in March and in the process created volatility rarely seen in fixed income markets. As U.S. Treasury prices jumped, option-adjusted U.S. high yield spreads widened from the 400 basis points (bps) range to 520 bps, then declined to approximately 470 bps in a matter of weeks.1 Despite unprecedented volatility, high yield investors largely stayed put and did not succumb to panic, as evidenced by the market’s wafer-thin volume and modest outflows from high yield mutual funds. Waiting out the turmoil seemed to be the playbook for investors and issuers alike.
Market Drivers
Concern over the health of the banking system was a new factor driving volatility toward the end of the first quarter, but the uncertainty that pervades the market is a continuation of the mood that has prevailed since the U.S. Federal Reserve began raising interest rates in March 2022. Since then, we have emphasized a focus on higher-rated issues and careful attention to market niches and credit selection. We have no direct high yield exposure to the banking industry in the U.S. and Europe, as the industry’s opacity regarding its balance sheet structure inhibits the thorough credit analyses we require before investing. Index exposure to banks is low (<1%) in U.S. high yield indices, however much larger in Europe at approximately 13%.2
Through the roller coaster of volatility, the technical backdrop has remained steady in high yield and loan markets. In the latter, the paucity of new supply and high levels of cash among managers have kept the market firm. At the same time, the fundamental environment has turned slightly more negative. In the U.S., the effect of last year’s rate hikes is beginning to be felt throughout the economy, affecting aggregate demand and raising costs. Add higher outlays for labor, and many corporations will likely have a harder time passing along their higher costs to customers. Lower reported first- and second-quarter earnings in some cases could be significantly below expectations, exacerbating volatility.
In the current uncertain environment, companies that are not highly leveraged and have ample cash and/or access to capital are best positioned to ride out any difficulties that emerge. High yield issuers overall, fortunately, are in a stronger financial position to ride out this period than they were pre-pandemic, since in the aggregate they have lower leverage and higher interest coverage. Notably, the credit quality of the global high yield bond market has also improved considerably over the past 15 years—BB issuers comprise 52% of developed markets high yield today, while single-B companies make up 38% (Figure 1).
Figure 1: A Higher-Quality Market
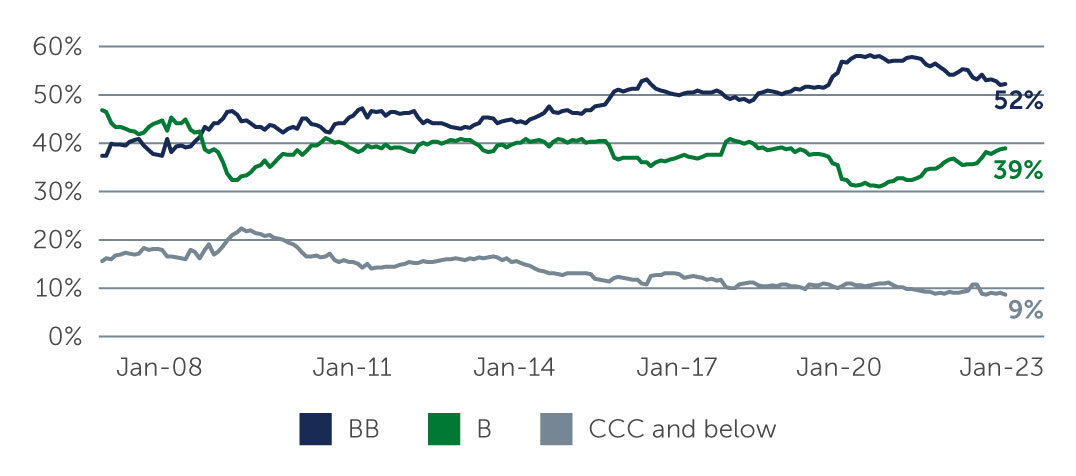
Source: Bank of America. As of March 31, 2023.
Default rates have remained very low in recent years and while defaults are likely to increase if the economy slows and credit conditions tighten, the higher quality of today’s market, the stronger prevailing credit fundamentals (Figure 2), and limited near-term re-financing needs should keep defaults near historic averages. Rigorous, bottom-up credit selection and a bias toward higher-rated issues remain key to managing default risk.
Figure 2: HY Corporates Are Starting From a Strong Base
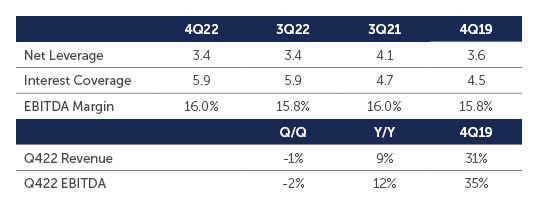
Source: J.P. Morgan. As of December 31, 2022.
Attractive Total Return Potential
Uncertainty about the future course of the economy and interest rates is likely to continue, making short-term forecasts challenging, especially considering market sentiment prone to skittishness. But reviewing the market’s certainties and looking beyond the current turbulence can provide a case for high yield investing on an absolute basis as well as in comparison to equities.
At the higher end of the quality spectrum, periods of mild recession in the past have had little impact on high yield issuers. In fact, investors who have stayed invested in high yield through periods of volatility, and even economic decline, have historically been rewarded with attractive, long-term returns. This is partly because high yield, unlike equities, does not require strong economic growth to perform well. Rather, what matters more in high yield is an issuer’s ability to continue to meet the interest payments on its outstanding debt obligations. Slow GDP growth, or even a short period of mildly negative growth, is unlikely to drive significant increase in defaults—particularly across a higher-quality market with solid underlying fundamentals.
In the meantime, in addition to offering attractive coupon payments, higher-quality bonds have traded at discounts to par, providing the potential for capital appreciation as maturity nears and eliminating the need to take on excessive risk by dipping into lower-quality credits. At the end of March, for instance, BB bonds were trading at an average price of 90, with a duration of under four years, and yielding around 7%.3 At the same time, the senior secured bond market was trading at an average price of 89, with a duration of three years, and yielding roughly 8.5%.3
The key point for investors is that if they can remain patient and are willing to hold on through roiling markets, potentially attractive total returns await.
Figure 3: Valuations at Current Levels Are Rare and Have Historically Led to Strong Double-Digit Returns Over the Following 12 Months
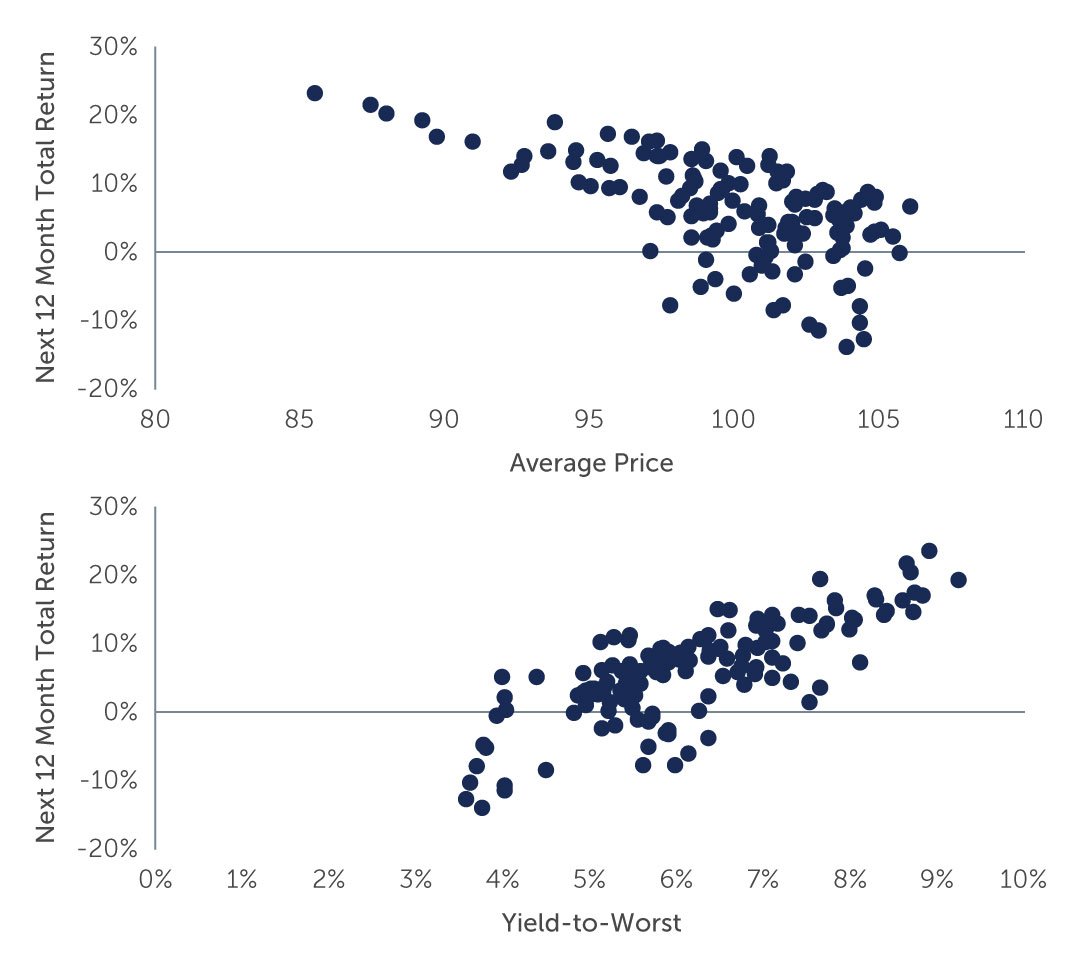
Source: Barings and ICE BofA. As of December 31, 2022. Global High Yield bond market represented by the ICE BofA Non-Financial Developed Market High Yield Constrained Index (USD Hedged) (HNDC). Total return next 12 months represents the return for the index for the 12 months following the price as of each date. Time period shown is the start of 2010 to the end of 2022 using month-end values. For illustrative purposes only. This analysis is intended to demonstrate only the specific elements discussed. This analysis does not represent all of the elements and variables that could be factored into the potential outcome.
1. Source: Bank of America. As of March 31, 2023.
2. Source: Bloomberg. Europe data for ICE BofA Euro High Yield Constrained Index, U.S. data for ICE BofA U.S. High Yield Constrained Index. As of March 22, 2023.
3. Source: Bank of America. As of March 31, 2023.
23-2837854