Why the Climate Transition Will Reshape the Global Economy: In Graphs
Climate change is one of the greatest risks of our time—and tackling it will likely drive a number of shifts across the world that investors need to understand.
Insights from the Barings Investment Institute
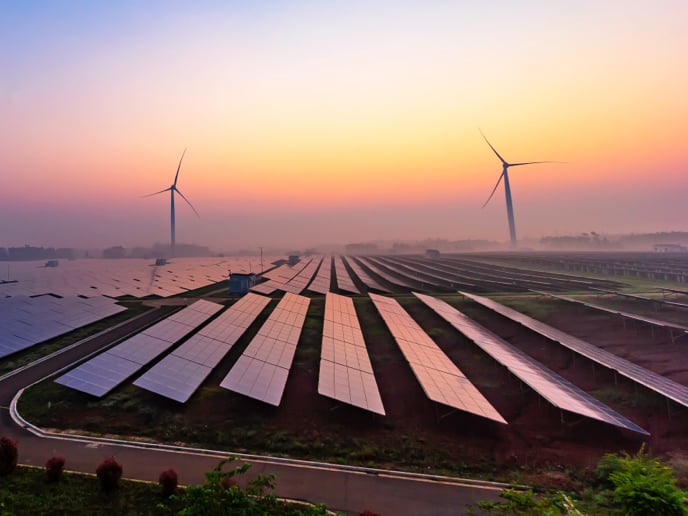
As we transition to a lower-carbon world, the global economy will be reshaped to meet the world’s climate goals and prepare to address climate change.
Notwithstanding the pandemic, energy use is growing. Since COP95, energy consumption has steadily increased, with 82% of today’s total energy consumption coming from fossil fuel sources. Only 13% comes from renewable energy, including wind, solar, biofuels, and hydroelectricity.1
The Majority of World Energy Consumption Still Comes From Fossil Fuels
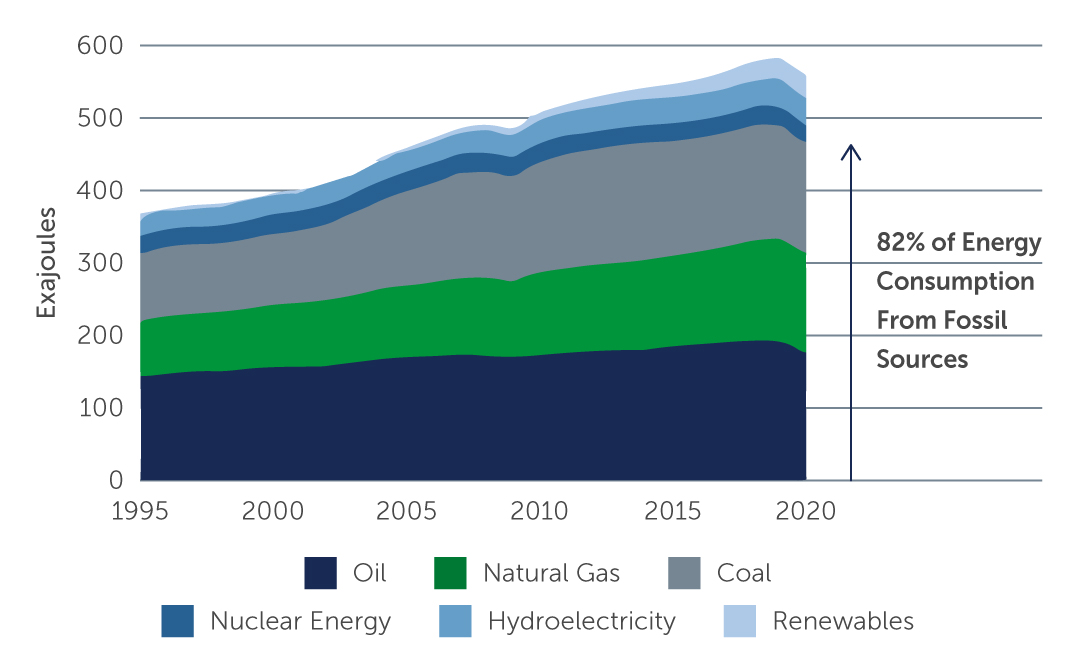 Source: World Energy Consumption, Fossil Fuels, BP 2022 Statistical Review of World Energy.
But the deployment of renewable energy requires land. The amount of agricultural land per capita has been steadily declining since the 1960s, meaning renewable energy sources will compete with humans, cattle and crops for this shrinking resource.
Land to Deploy Renewable Energy is Growing Scarce
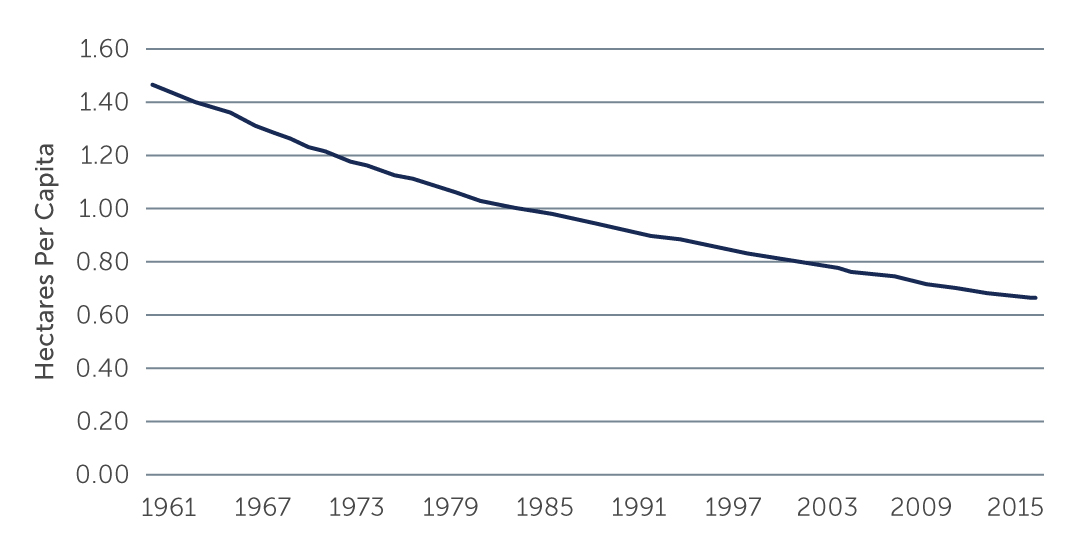 Source: Global Agricultural Land, Hectares Per Capita, World Bank. As of 2016.
In addition, renewable energy doesn’t provide the same intensity of energy as fossil fuels, meaning more land and resources are required. If we were to power Europe only with solar energy, for example, it would take a surface half of Europe’s urban land.2
Renewable energy sources also require far more minerals than the energies they’ll replace, which will lead to huge competition for resources.
Renewable Energy Sources Require More Minerals Than Conventional Ones
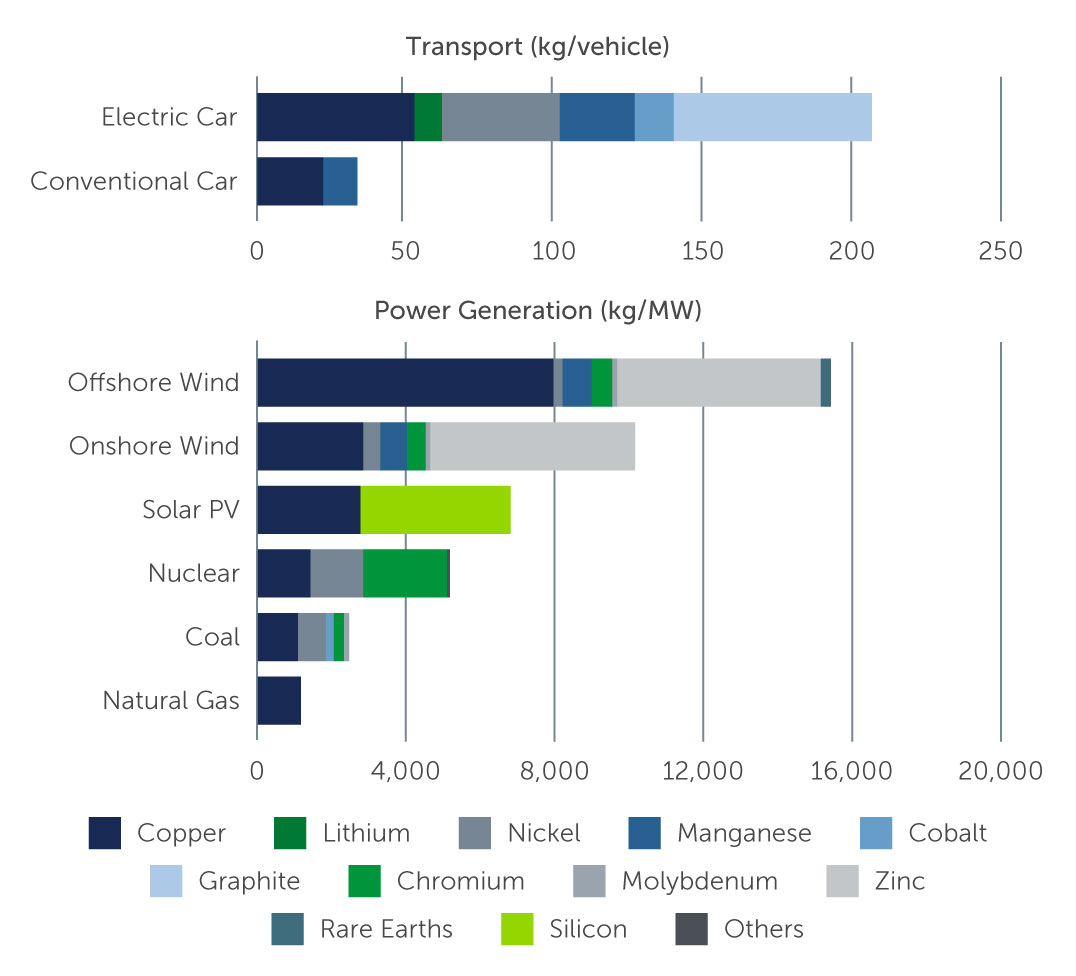 Source: Mineral Intensity, Renewable Energy Sources, The Role of Critical Minerals in Clean Energy Transitions, IEA. As of May 2021.
To illustrate this, electric cars require five times the minerals used in conventional cars. 61 different metals are needed for electric vehicles, 13 for wind and 20 for solar panels.
Because it takes a long time to open new mines—an average of seven years—demand for metals and minerals will be so high, it will overtake supply.
Miners Will Struggle to Feed Demands with the Current Project Pipeline
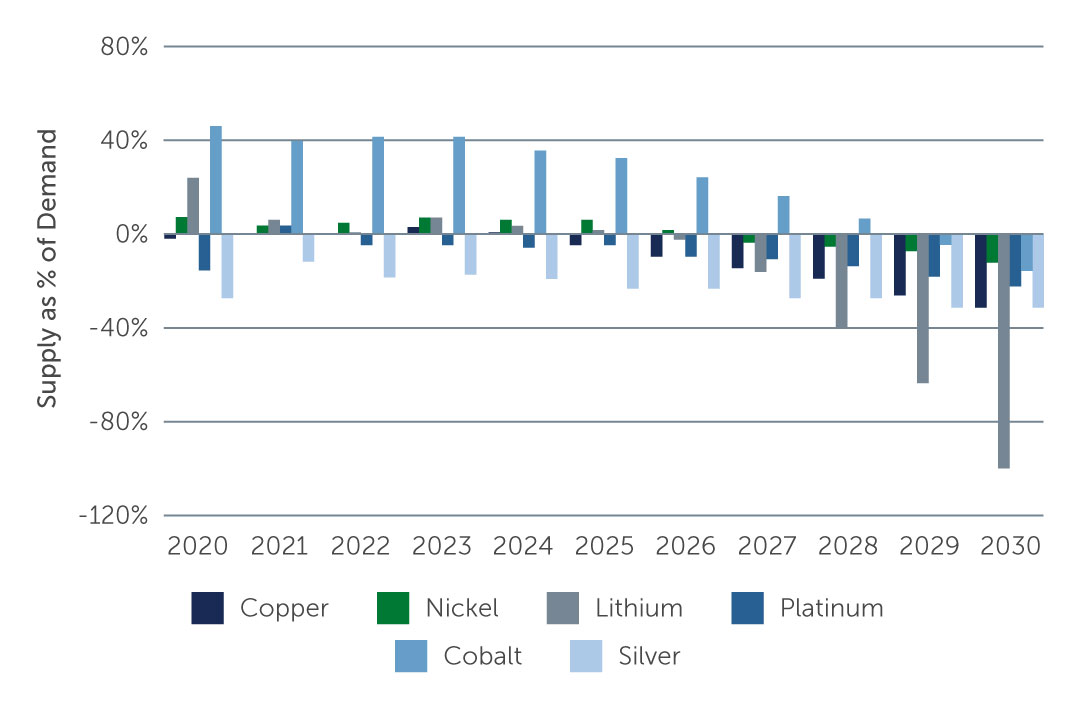 Source: Demand for Metals and Minerals, Bank of America, Metals Strategist.
Many countries are trying to reduce the permit process for opening mines but are confronted with a number of environmental and social checks to which they need to find a solution.
By 2024, demand will overtake supply for copper, and by 2027, the same will be true for lithium, nickel and platinum. By 2030, there will be 100% more demand than supply for lithium.3
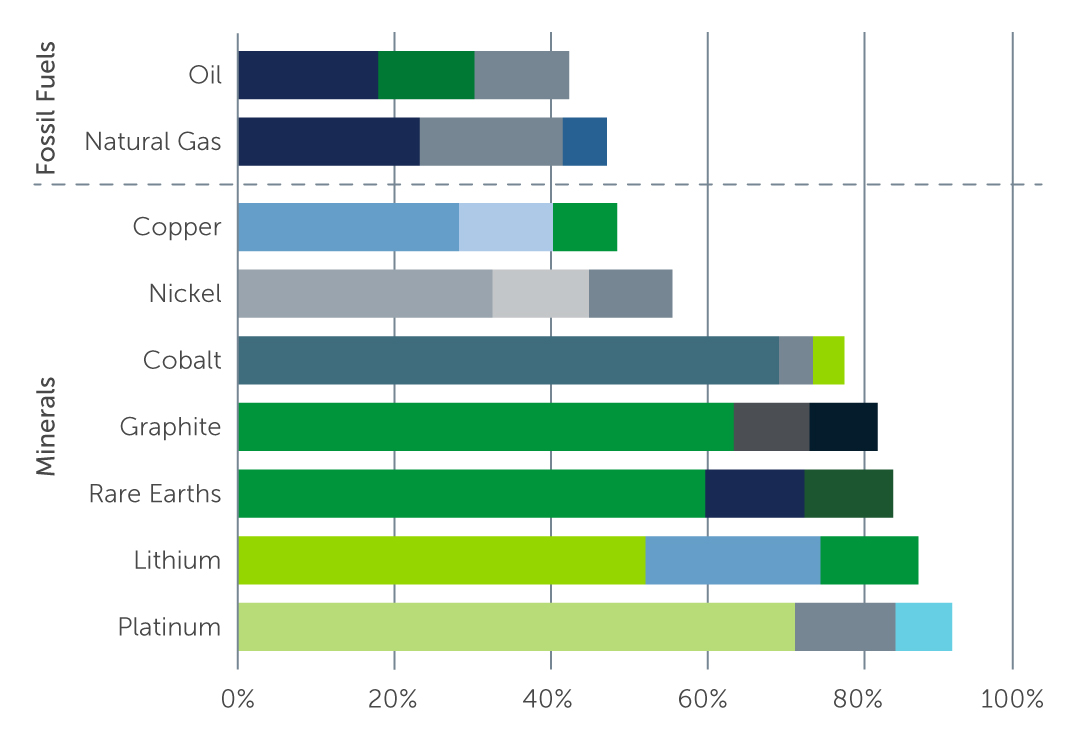
We’ll rely heavily on (mostly) emerging markets for the minerals and metals needed for renewable energy. 75 percent of lithium and cobalt are controlled by three producers: Australia, Democratic Republic of Congo and China.
China, Australia and the DRC Will Produce the Majority of Minerals Required for Renewable Energy
China Will Process the Majority of Metals and Minerals
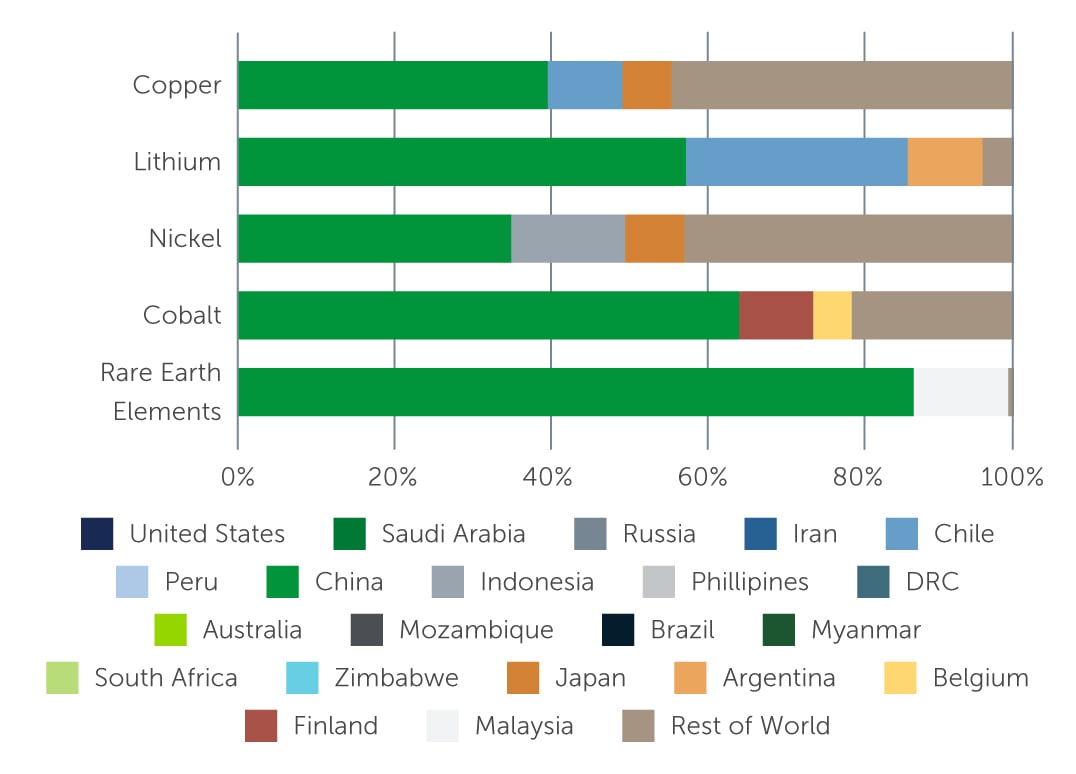 Source: Share of the Top Three Producing Countries in Total Production, Share of Processing Volumes Per Country, The Role of Critical Minerals in Clean Energy Transitions, IEA. As of May 2021.
China also dominates the costly and energy-intensive refining and processing of these minerals, particularly nickel and zinc.
Governments will need to have plans in place about how they will turn their carbon pledges into action, as securing supply of these minerals will require new strategic alliances.
Because resource-rich emerging economies are most at risk from climate change, it could be mutually beneficial for them to agree to enter alliances with countries that need to electrify and decarbonize the most.
Asian and African countries’ GDP is Most at Risk From Climate Change
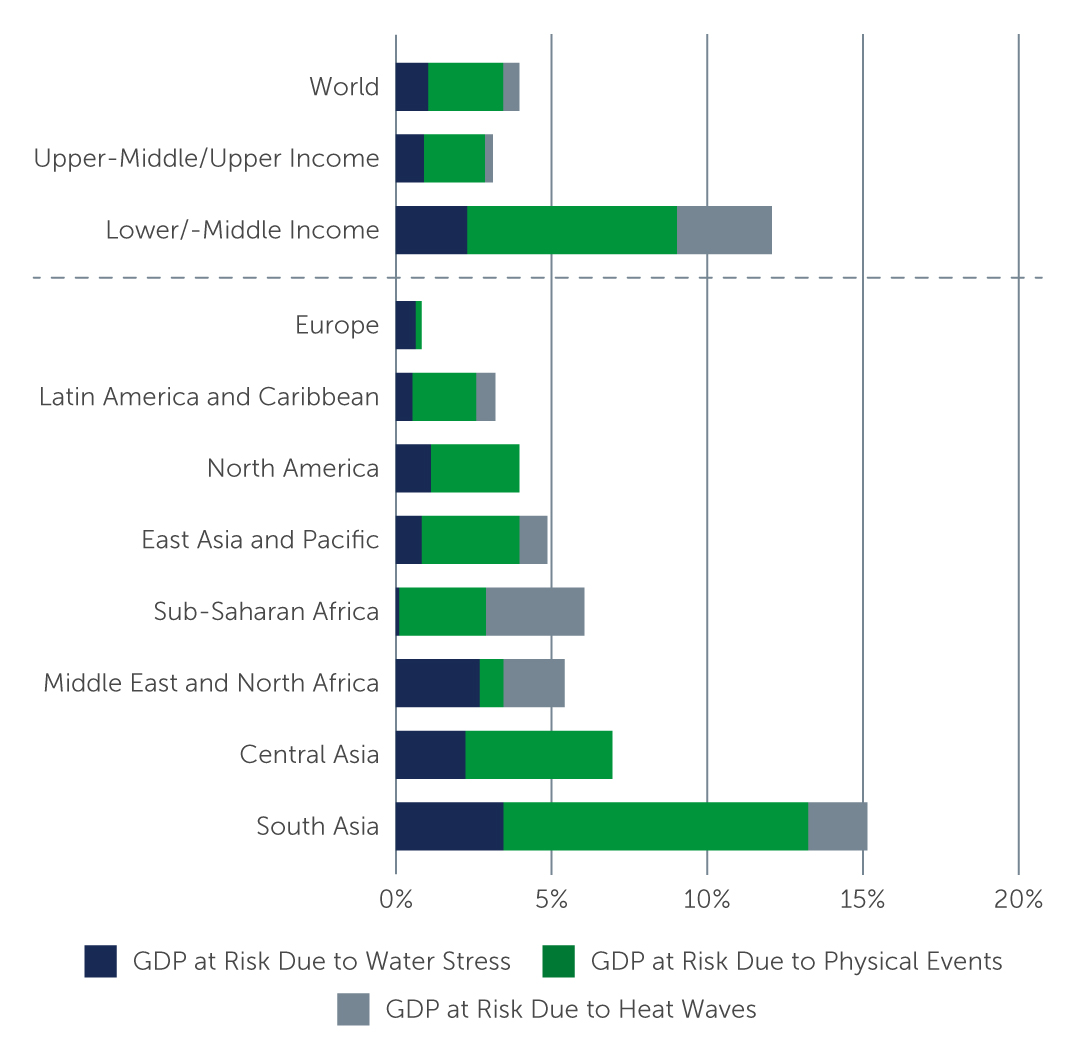 Source: GDP at Risk, S&P, Physical Climate Risks: Global and Country Analysis. As of May 2022.
In terms of GDP at risk, Europe, Latin America and North America are the least exposed, while resource-rich Asian and African countries are the most.
In fact, South Asia will be over ten times more exposed than Europe in 2050.4
Want to read the full article?
1. Source: BP 2022 Statistical Review of World Energy.
2. Source: Scientific Reports. As of February 3, 2021.
3. Source: Bank of America, Metals Strategist.
4. Source: S&P, as of May 2022.
22-2409031