
Unlocking Hidden Value in Carbon-Intensive Companies
In the race toward net zero, the ‘cost of carbon’ may continue to affect company valuations. Understanding this potential impact is critical to identifying those businesses that are best-positioned for long-term outperformance.
Carbon Costs are Here—and Increasing in Scope
Policy Tools
The increasingly urgent climate crisis is well-acknowledged around the globe—and while solving it presents a complex challenge, one crucial component of the solution is to drastically reduce greenhouse gas (GHG) emissions. Efforts to do so are widespread, with many countries setting their own reduction goals. Meeting these goals, in large part, depends on the ability of companies to significantly lower their own carbon emissions. To encourage this, governments around the world have proposed or implemented policy tools, including carbon emissions trading systems (ETS) and other carbon taxes. These tools assign costs to carbon emissions, essentially making companies pay for the GHGs they emit.
Worldwide, nearly 25% of GHG emissions are now covered by such pricing mechanisms. Perhaps most notably, China launched its ETS in 2020, which, when fully operational, will likely eclipse the European Union ETS, the world’s first and largest major carbon market. Many jurisdictions have also voiced their intentions to further their reduction efforts going forward. The EU, for example, has proposed a Carbon Border Adjustment Mechanism (CBAM) as part of its “Fit for 55” package. This policy aims to put a carbon price on imports of certain products, with the intention of leveling the playing field against jurisdictions where policies aimed to fight climate change are less ambitious than those of the EU.
Against this backdrop, it’s clear that carbon costs are here, and increasing in scope. For high carbon-emitting companies, in particular—such as those in the materials, energy, automotive, airlines, shipping and utilities sectors—these policy tools will likely become a significant cost burden in the years ahead, which could impact companies’ profitability.
Figure 1: Nearly 25% of Global GHG Emissions Are Covered by Carbon Taxes and ETS
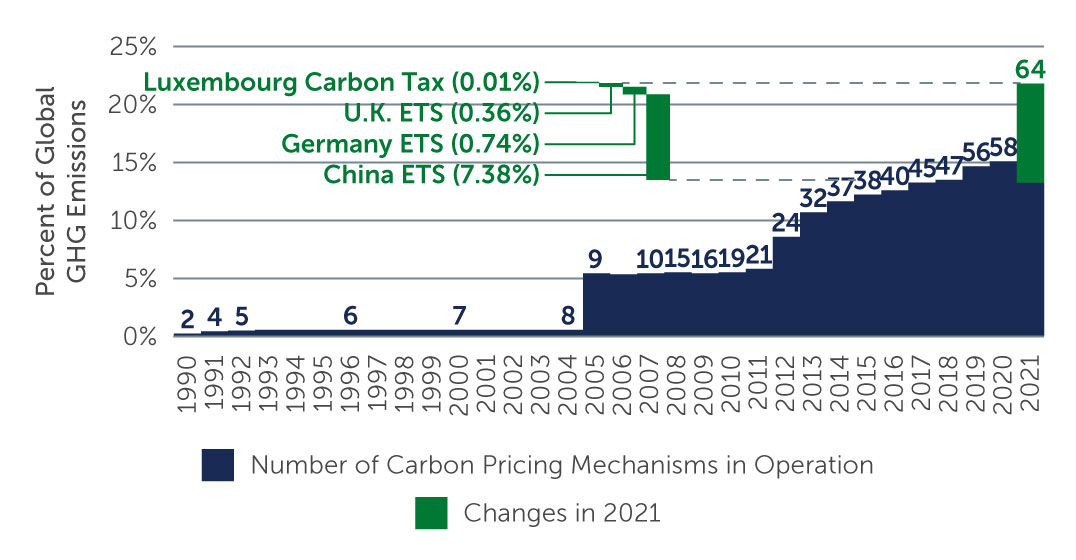 Source: Share of annual global GHG emissions for 1990–2015 is based on data from the Emission Database for Global Atmospheric Research (EDGAR) version 5.0 including biofuels emissions. From 2015 onward, the share of global GHG emissions is based on 2015 emissions from EDGAR. As of 2021.